

JavaScript is a language that most browsers will support by default. In most case they also have tools for developers to use. These tools are often known as developer tools.
This part of the tutorial will explain how to use these to test JavaScript code.
Developer tools
This tutorial covers how to use the developer tools, specifically in four major browsers:
- Apple Safari
- Google Chrome
- Microsoft Edge
- Mozilla Firefox
In Safari (macOS and Mac OS X only), the developer tools options can be found once the Advanced setting 'Show Develop menu in menu bar' is turned on. To do this, open Preferences from the Safari menu.
After this has been enabled the Web Inspector can be found under the new Develop menu:
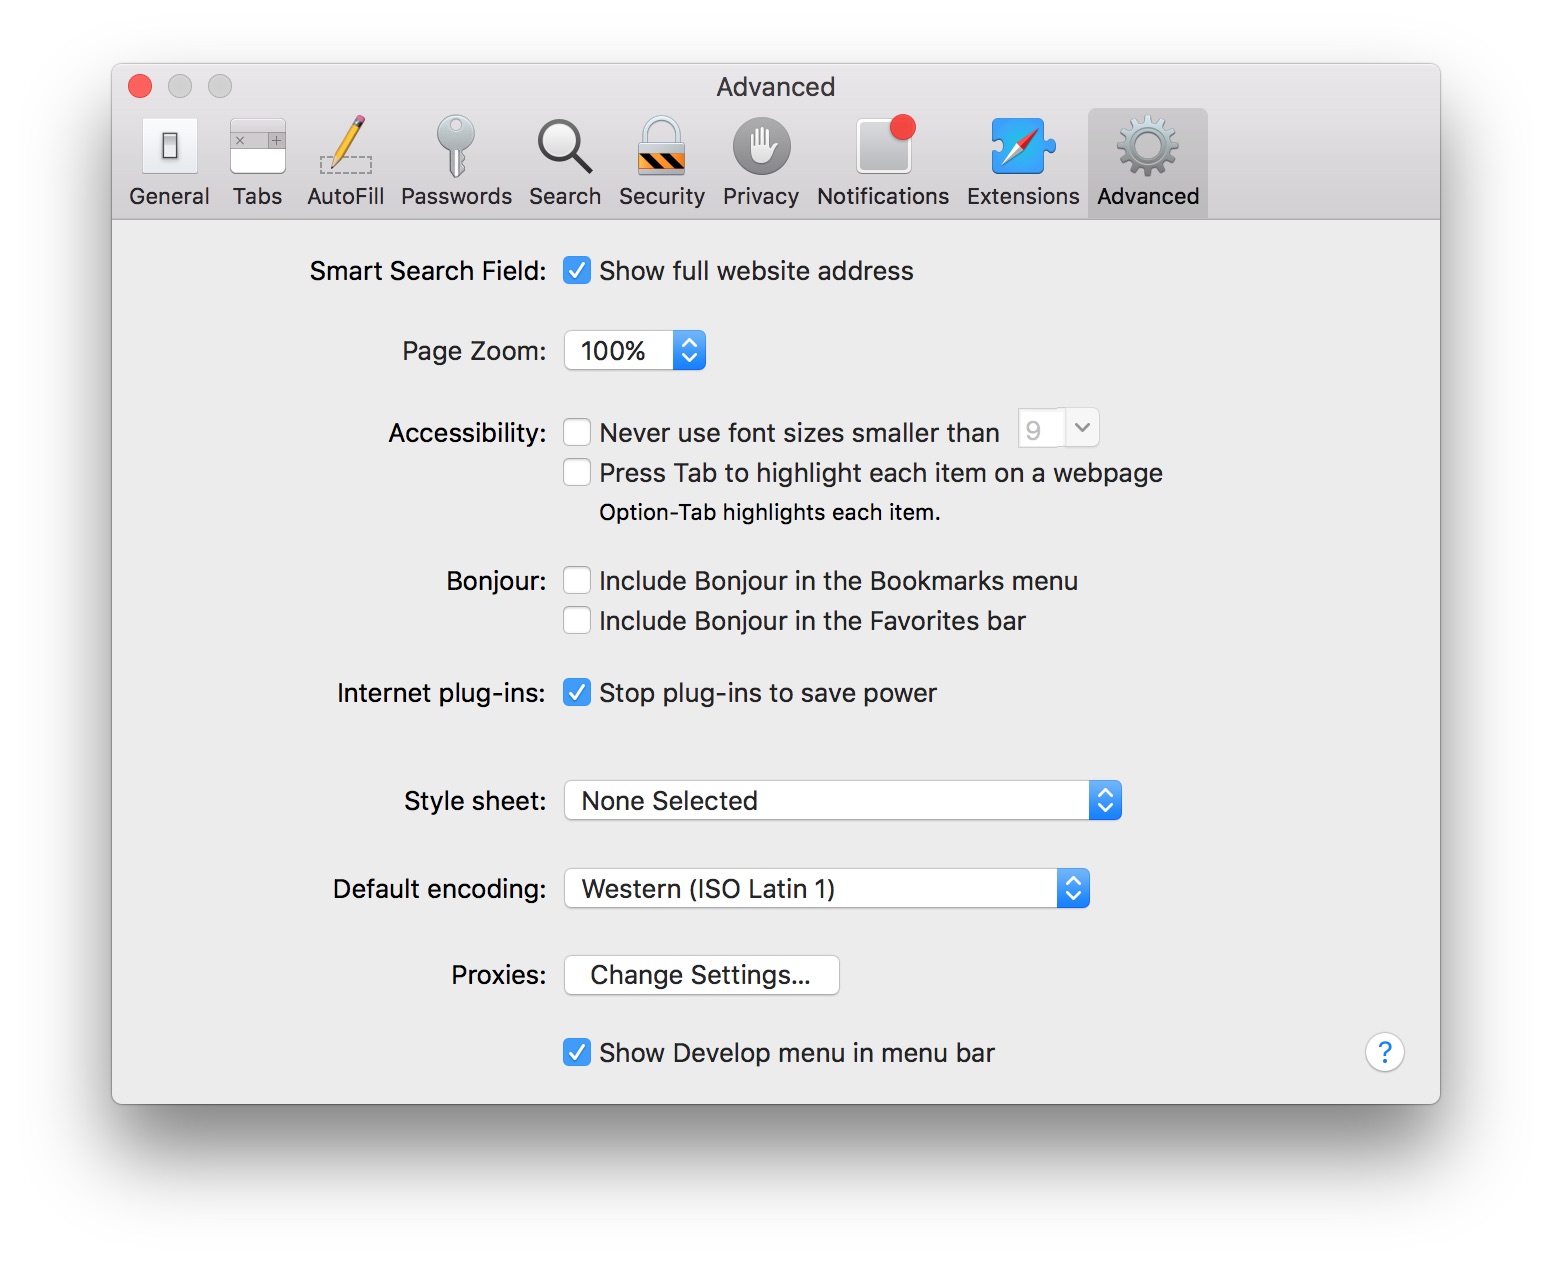
Safari Preferences
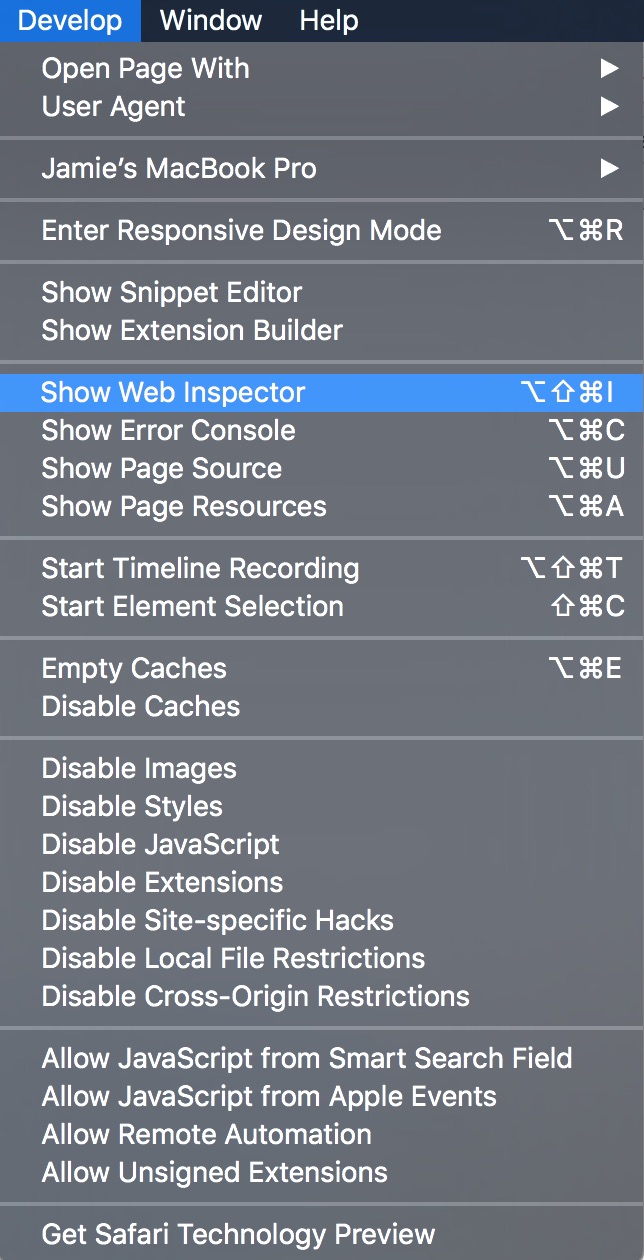
Safari Develop menu
The following image shows the Safari developer console:
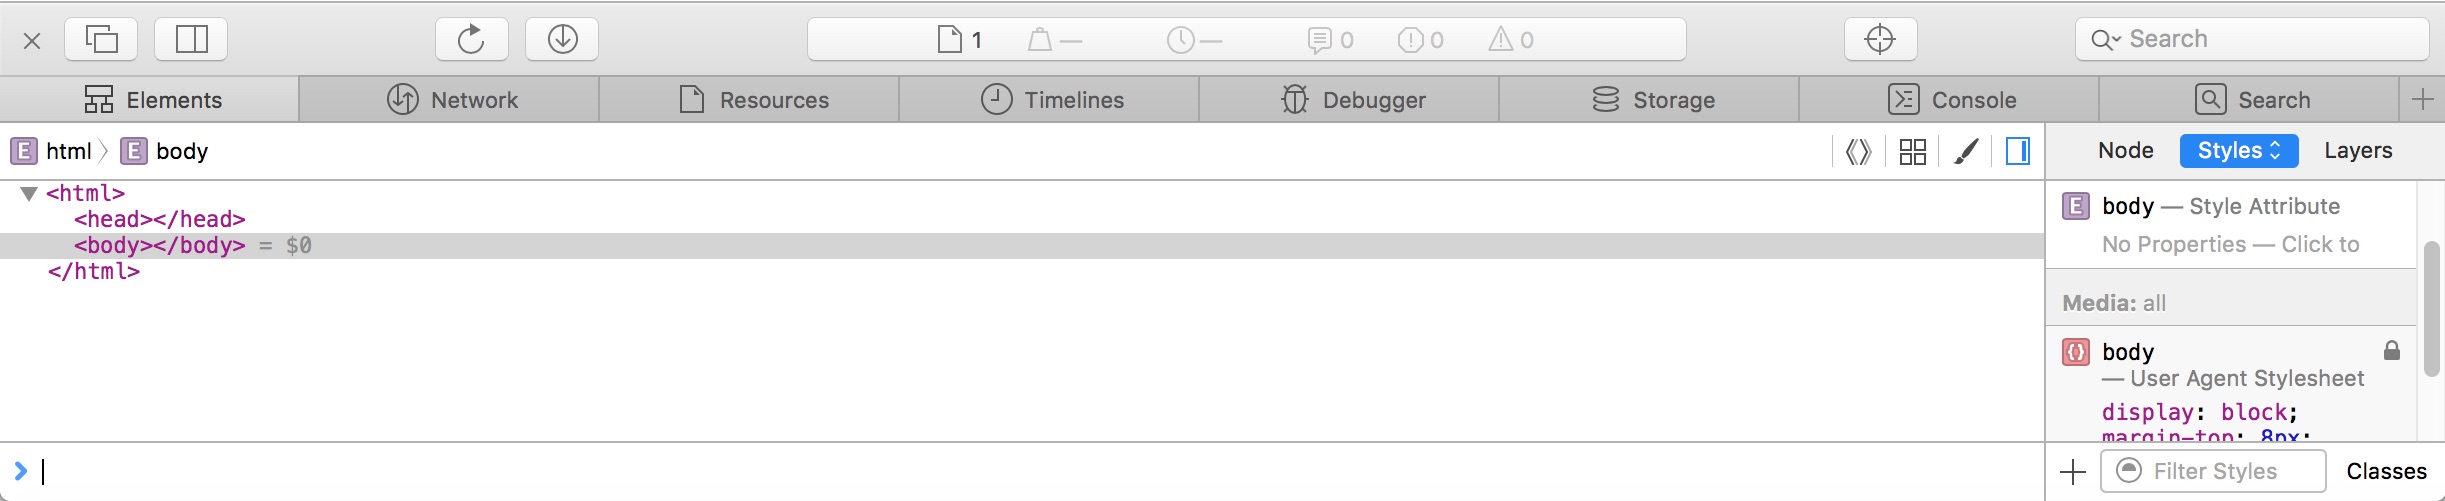
Apple Safari console
In Google Chrome the DevTools can be found under the dropdown menu at the right, then More Tools > Developer Tools:
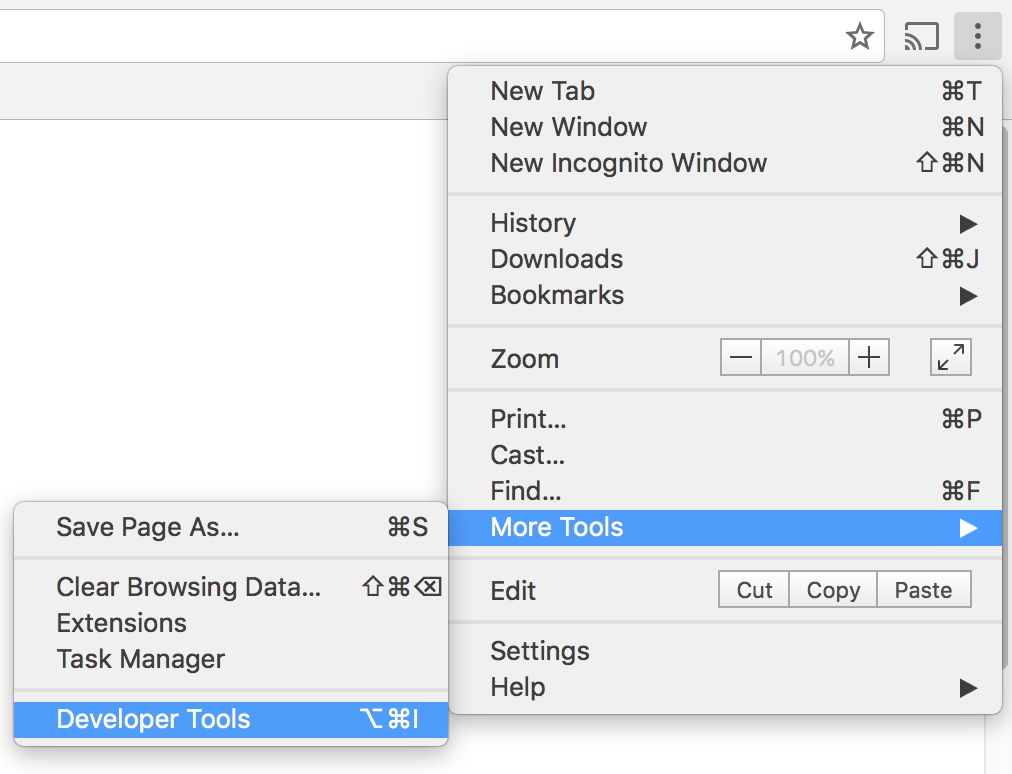
Google Chrome DevTools
The following image shows the Chrome developer console:
Google Chrome console
In Microsoft Edge (Windows 10 only), the developer tools can be found under the main menu at the right handside and then under F12 Developer Tools:
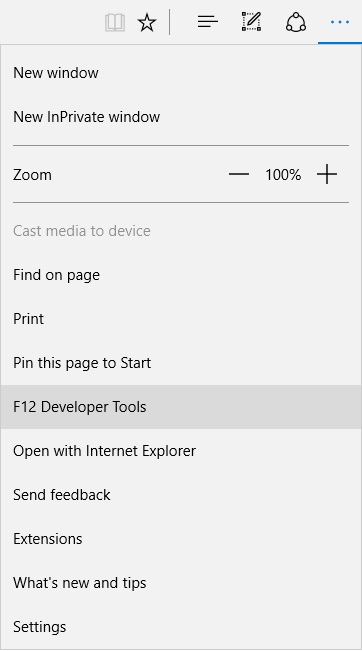
Microsoft Edge menu
The following image shows the Edge developer console:
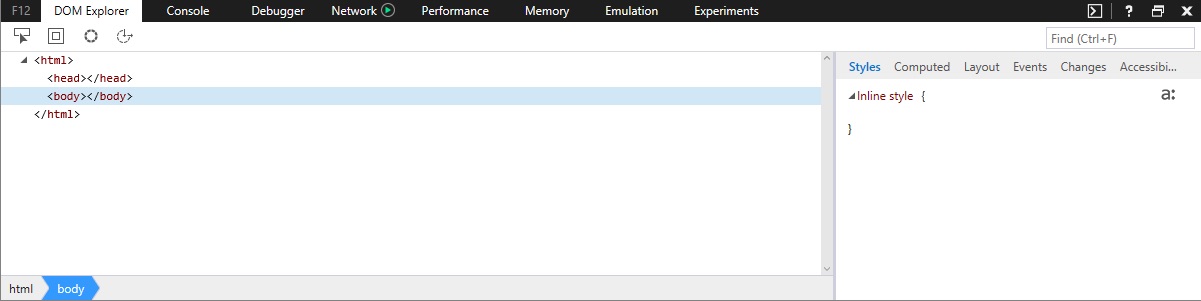
Microsoft Edge console
With Mozilla Firefox, it's easy to find the developer tools. The first step is to click on the Hamburger menu at the right hand side. Once in there select Developer and from that menu select Toggle Tools.
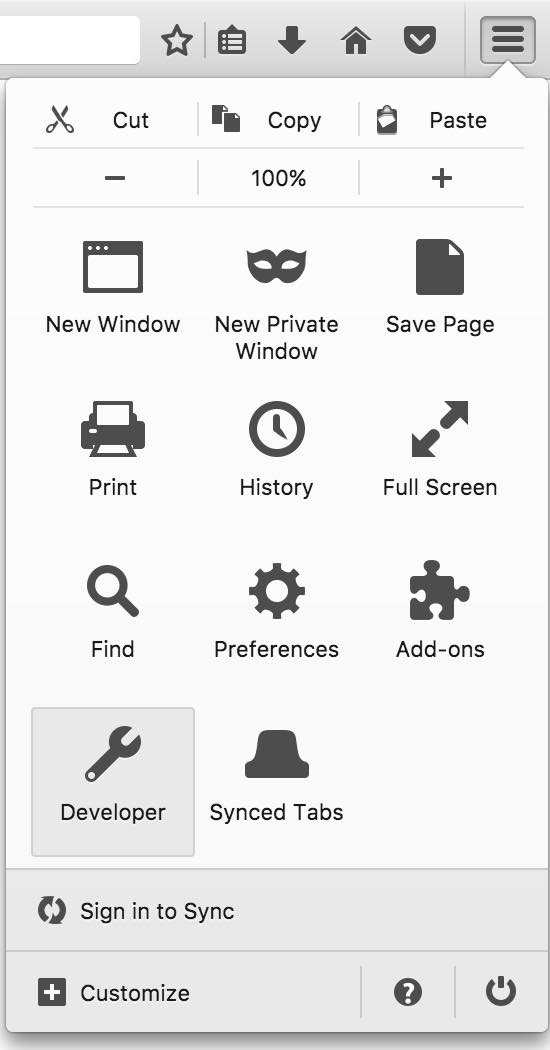
Firefox menu
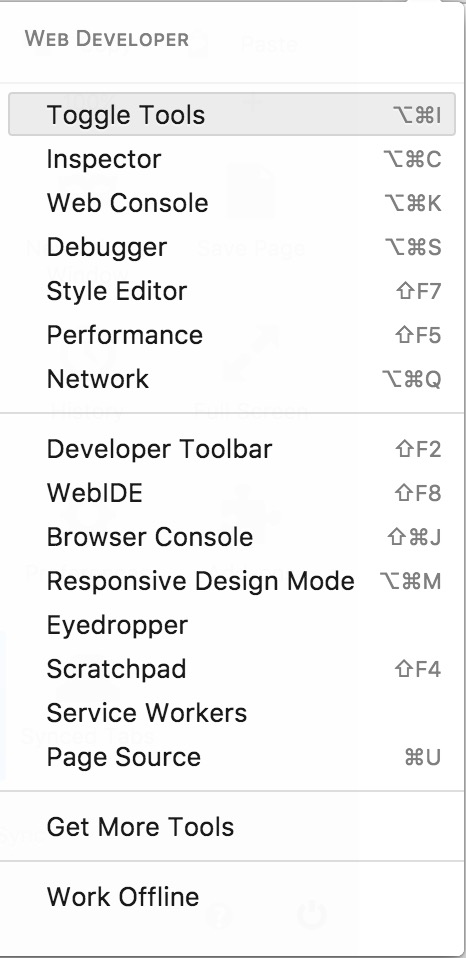
Firefox Web Developer tools
The following image shows the Firefox developer console:
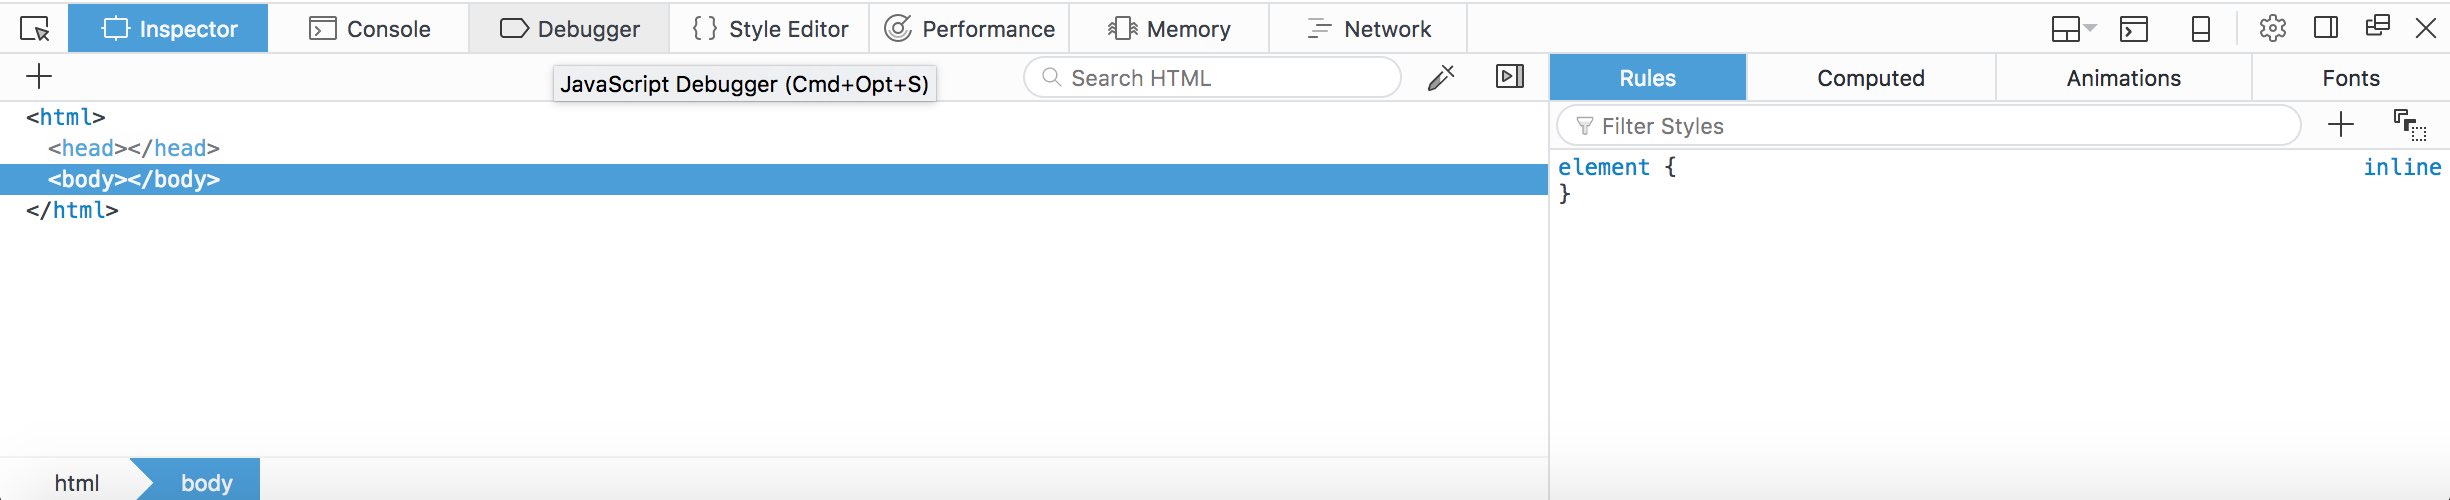
Mozilla Firefox console
The console
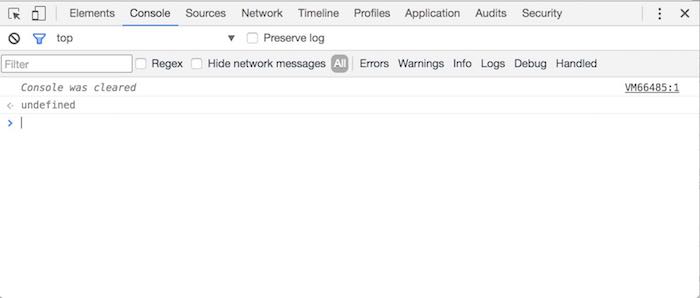
The console is what will appear once the above steps have been carried out. The following image shows the Google Chrome DevTools console:
Google Chrome console
Using the console or developer tools will require some JavaScript.
Clearing the console
The console can be cleared when the content of it becomes difficult to read. This will empty the contents of the console completely:
console.clear();
Writing to the console
The console is one of the main ways to debug JavaScript. It allows outputs (and inputs) to be done in the background. This is known as being unobtrusive.
The following sample is an example of writing to the console with JavaScript:
console.log(10);
console.log("Hello world");
Producing errors from the console
The console can also produce errors to make results more clear:
console.error("Failure");